本文为原创文章,未经本人允许,禁止转载。转载请注明出处。
1.神经网络
神经网络的基本知识本文不再赘述。这里只简单的说一种比较特殊的神经网络结构:
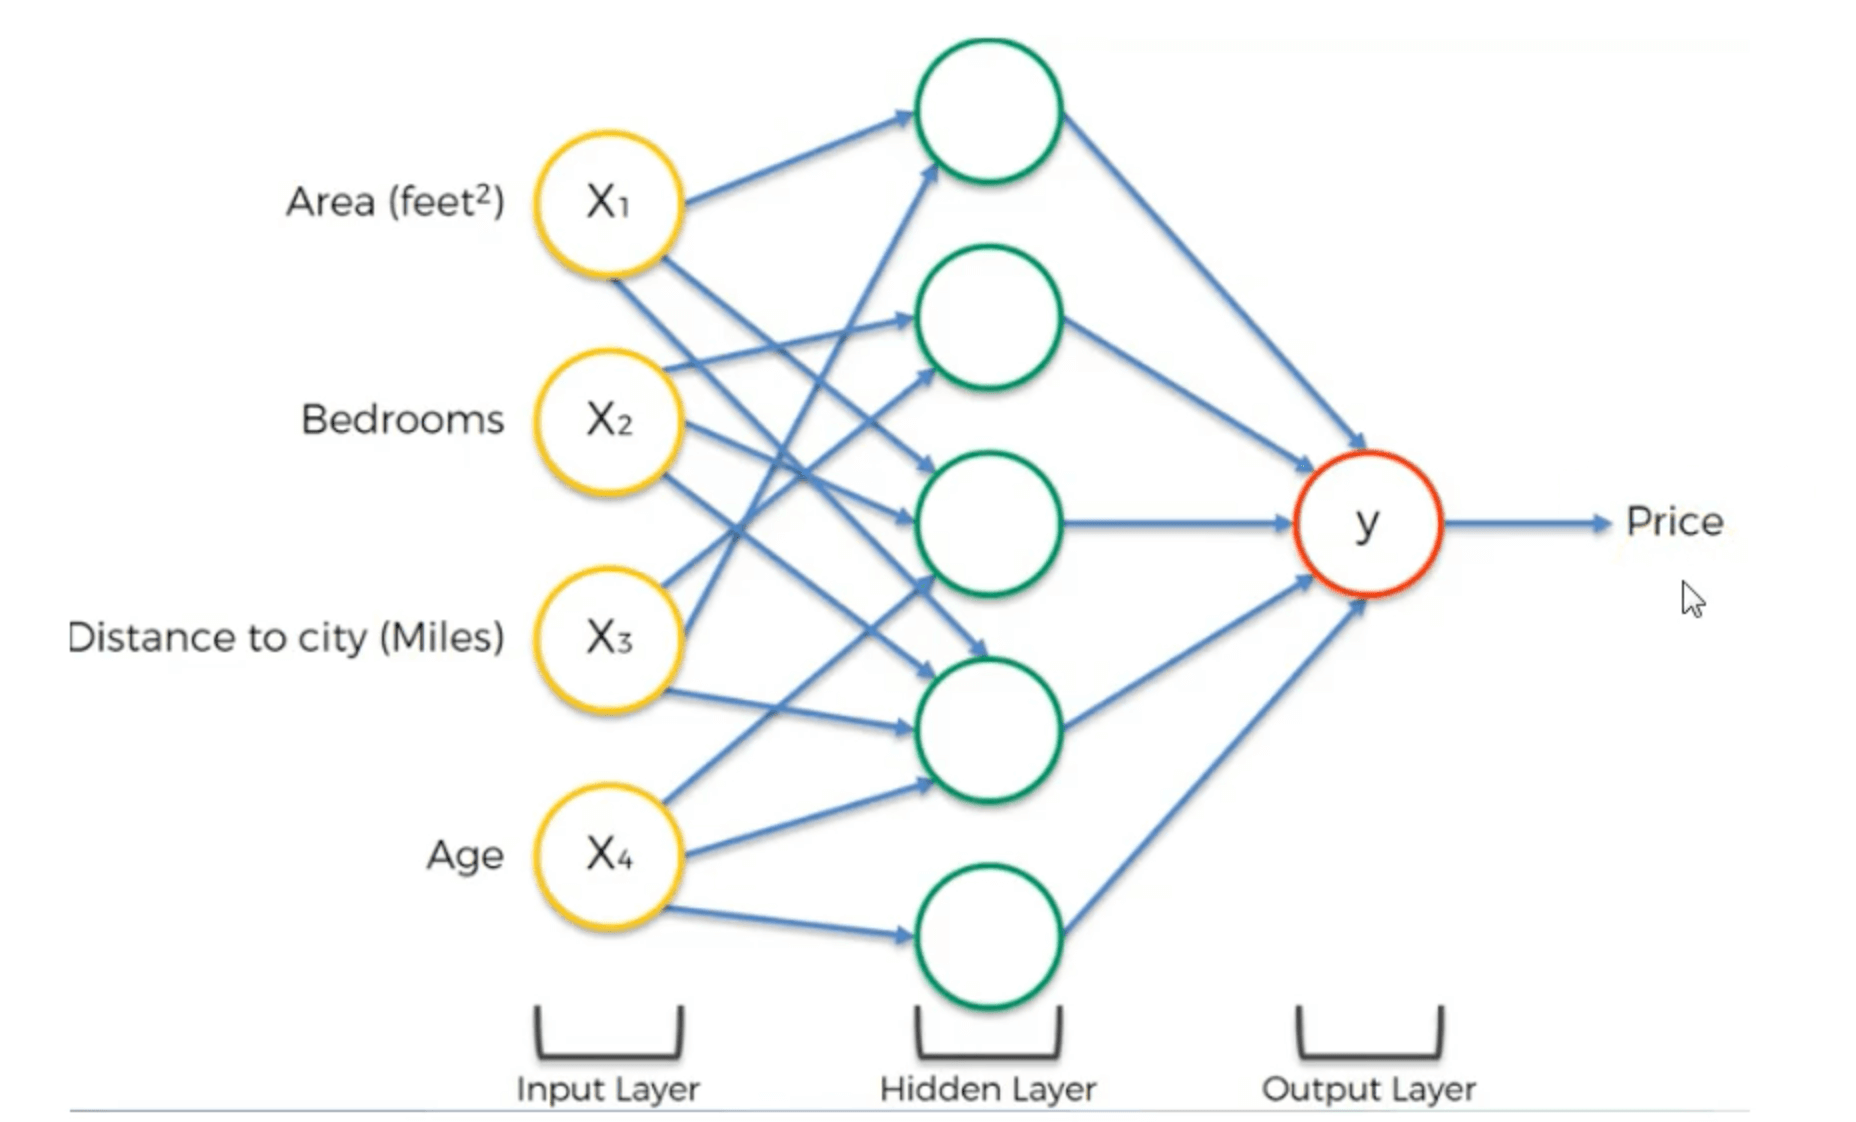
相比全连接神经网络,其连接相对稀疏,并没有做到相邻层中每两个神经元之间都连接。
2.Python实现
本文只针对比较简单的全连接神经网络。
2.1.读取数据
1
2
3
4
5
6
7
from sklearn.datasets import load_digits
import matplotlib.pyplot as plt
from sklearn.neural_network import MLPClassifier
from sklearn.preprocessing import StandardScaler
import numpy as np

digits = load_digits()
digits数据集概览print(digits.DESCR):
1
2
3
4
5
6
7
8
9
10
11
12
13
14
15
16
17
18
19
20
21
22
23
24
25
26
27
28
29
30
31
32
33
34
35
36
37
38
39
40
41
42
43
44
45
Optical Recognition of Handwritten Digits Data Set
===================================================

Notes
-----
Data Set Characteristics:
    :Number of Instances: 5620
    :Number of Attributes: 64
    :Attribute Information: 8x8 image of integer pixels in the range 0..16.
    :Missing Attribute Values: None
    :Creator: E. Alpaydin (alpaydin '@' boun.edu.tr)
    :Date: July; 1998

This is a copy of the test set of the UCI ML hand-written digits datasets
http://archive.ics.uci.edu/ml/datasets/Optical+Recognition+of+Handwritten+Digits

The data set contains images of hand-written digits: 10 classes where
each class refers to a digit.

Preprocessing programs made available by NIST were used to extract
normalized bitmaps of handwritten digits from a preprinted form. From a
total of 43 people, 30 contributed to the training set and different 13
to the test set. 32x32 bitmaps are divided into nonoverlapping blocks of
4x4 and the number of on pixels are counted in each block. This generates
an input matrix of 8x8 where each element is an integer in the range
0..16. This reduces dimensionality and gives invariance to small
distortions.

For info on NIST preprocessing routines, see M. D. Garris, J. L. Blue, G.
T. Candela, D. L. Dimmick, J. Geist, P. J. Grother, S. A. Janet, and C.
L. Wilson, NIST Form-Based Handprint Recognition System, NISTIR 5469,
1994.

References
----------
  - C. Kaynak (1995) Methods of Combining Multiple Classifiers and Their
    Applications to Handwritten Digit Recognition, MSc Thesis, Institute of
    Graduate Studies in Science and Engineering, Bogazici University.
  - E. Alpaydin, C. Kaynak (1998) Cascading Classifiers, Kybernetika.
  - Ken Tang and Ponnuthurai N. Suganthan and Xi Yao and A. Kai Qin.
    Linear dimensionalityreduction using relevance weighted LDA. School of
    Electrical and Electronic Engineering Nanyang Technological University.
    2005.
  - Claudio Gentile. A New Approximate Maximal Margin Classification
    Algorithm. NIPS. 2000.
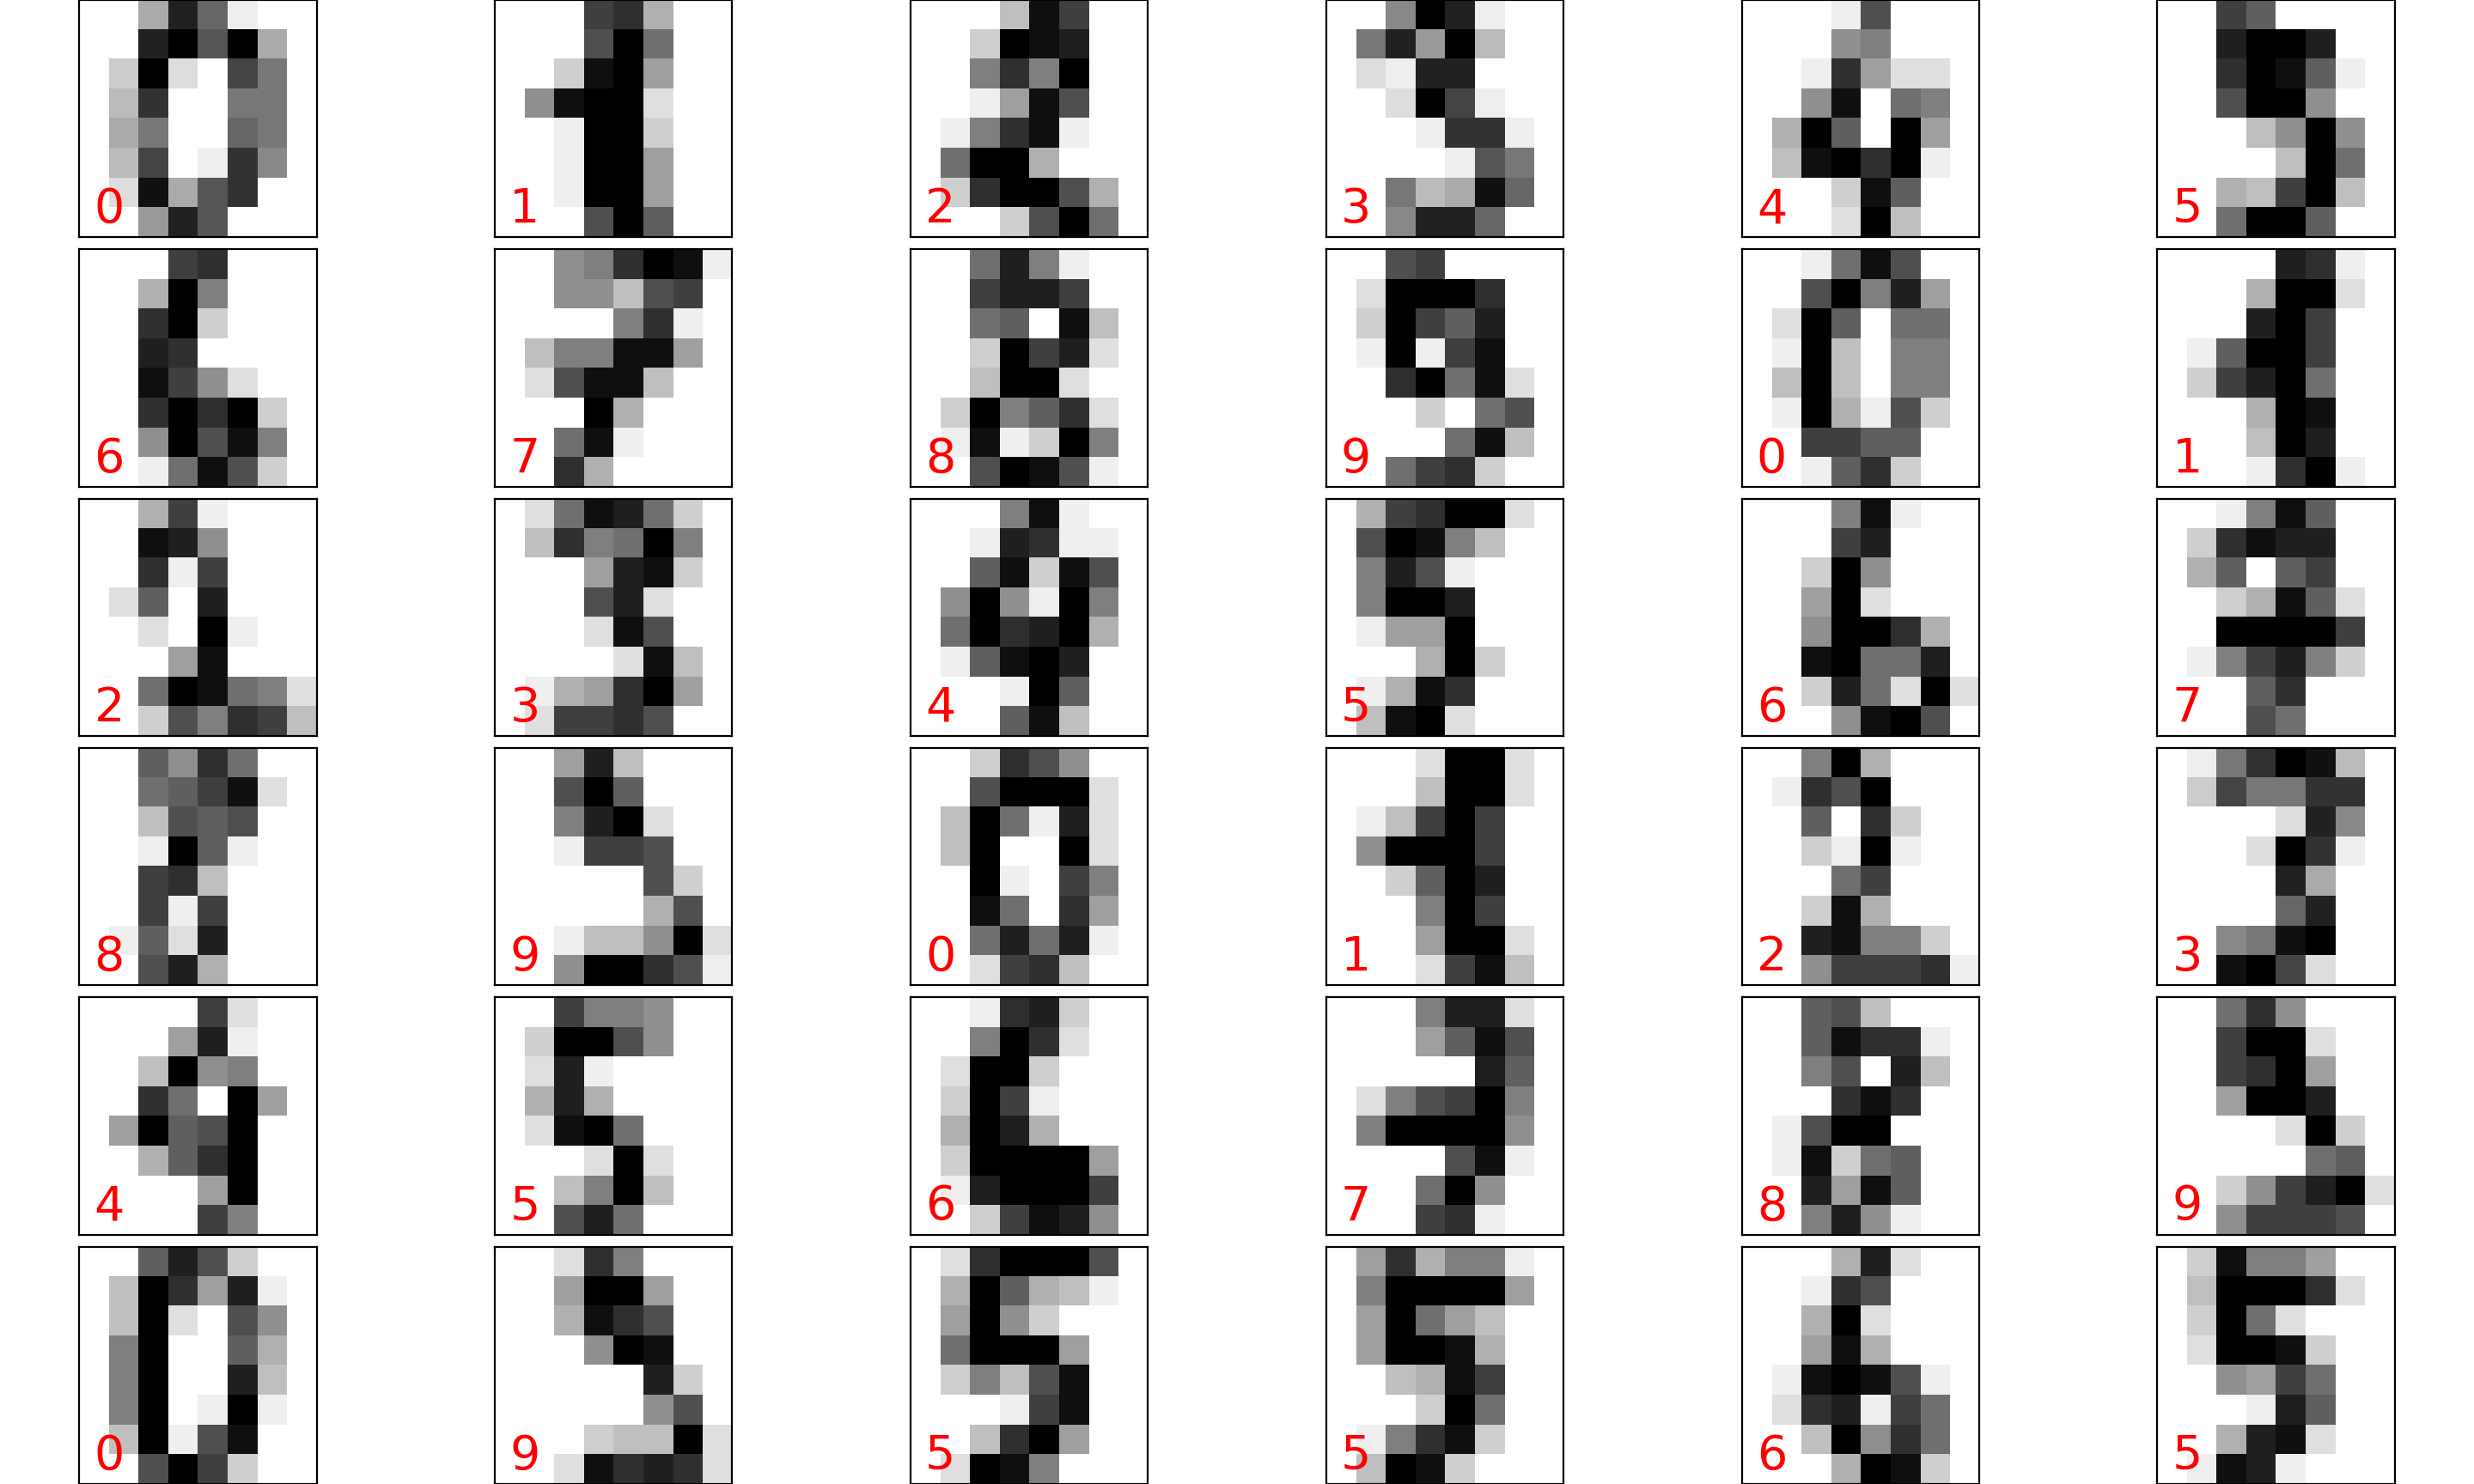
digits数据集可视化:
1
2
3
4
5
6
7
fig = plt.figure(figsize=(8, 8))
fig.subplots_adjust(left=0, right=1, bottom=0, top=1, hspace=0.05, wspace=0.05)
for i in range(36):
    ax = fig.add_subplot(6, 6, i + 1, xticks=[], yticks=[])
    ax.imshow(digits.images[i], cmap=plt.cm.binary, interpolation='nearest')
    ax.text(0, 7, str(digits.target[i]), color="red", fontsize=20)
plt.show()
可视化部分相关函数的介绍见第3部分。
2.2.数据预处理
1
2
3
4
5
6
7
8
print(digits.data.shape)
print(digits.data)

scaler = StandardScaler()
scaler.fit(digits.data)
X_sacled = scaler.transform(digits.data)

print(X_sacled)
1
2
3
4
5
6
7
8
9
10
11
12
13
14
15
16
17
18
19
20
21
(1797, 64)
[[ 0.  0.  5. ...  0.  0.  0.]
 [ 0.  0.  0. ... 10.  0.  0.]
 [ 0.  0.  0. ... 16.  9.  0.]
 ...
 [ 0.  0.  1. ...  6.  0.  0.]
 [ 0.  0.  2. ... 12.  0.  0.]
 [ 0.  0. 10. ... 12.  1.  0.]]
[[ 0.         -0.33501649 -0.04308102 ... -1.14664746 -0.5056698
  -0.19600752]
 [ 0.         -0.33501649 -1.09493684 ...  0.54856067 -0.5056698
  -0.19600752]
 [ 0.         -0.33501649 -1.09493684 ...  1.56568555  1.6951369
  -0.19600752]
 ...
 [ 0.         -0.33501649 -0.88456568 ... -0.12952258 -0.5056698
  -0.19600752]
 [ 0.         -0.33501649 -0.67419451 ...  0.8876023  -0.5056698
  -0.19600752]
 [ 0.         -0.33501649  1.00877481 ...  0.8876023  -0.26113572
  -0.19600752]]
StandardScaler用于去均值和方差归一化。且是针对每一个特征维度来做的,而不是针对样本。
2.3.模型构建
1
2
3
#构建三个隐藏层,每个隐藏层都有30个神经元
mlp = MLPClassifier(hidden_layer_sizes=(30, 30, 30), activation='logistic', max_iter=100)
mlp.fit(X_sacled, digits.target)
2.4.预测结果
1
2
3
4
5
6
7
8
predicted = mlp.predict(X_sacled)
fig = plt.figure(figsize=(8, 8))
fig.subplots_adjust(left=0, right=1, bottom=0, top=1, hspace=0.05, wspace=0.05)
for i in range(36):
    ax = fig.add_subplot(6, 6, i + 1, xticks=[], yticks=[])
    ax.imshow(digits.images[i], cmap=plt.cm.binary, interpolation='nearest')
    ax.text(0, 7, str('{}-{}'.format(digits.target[i], predicted[i])), color="red", fontsize=20)
plt.show()

统计准确率:
1
2
3
4
5
res = []
for i, j in zip(digits.target, predicted):
    res.append(i == j)
print(sum(res) / len(digits.target))
#0.9515859766277128
3.可视化函数
3.1.plt.figure
1
fig = plt.figure(figsize=(a, b), dpi=dpi)
- figsize设置图像的大小,a为图像的宽,b为图像的高,单位为英寸。
- dpi设置图像每英寸的像素点数。
此时图像的分辨率(即像素点数)为:$(a\cdot dpi,b\cdot dpi)$。
3.2.subplots_adjust
1
2
3
4
5
6
7
8
9
def subplots_adjust(
	self,
	left=None,
	bottom=None,
	right=None,
	top=None,
	wspace=None,
	hspace=None
)
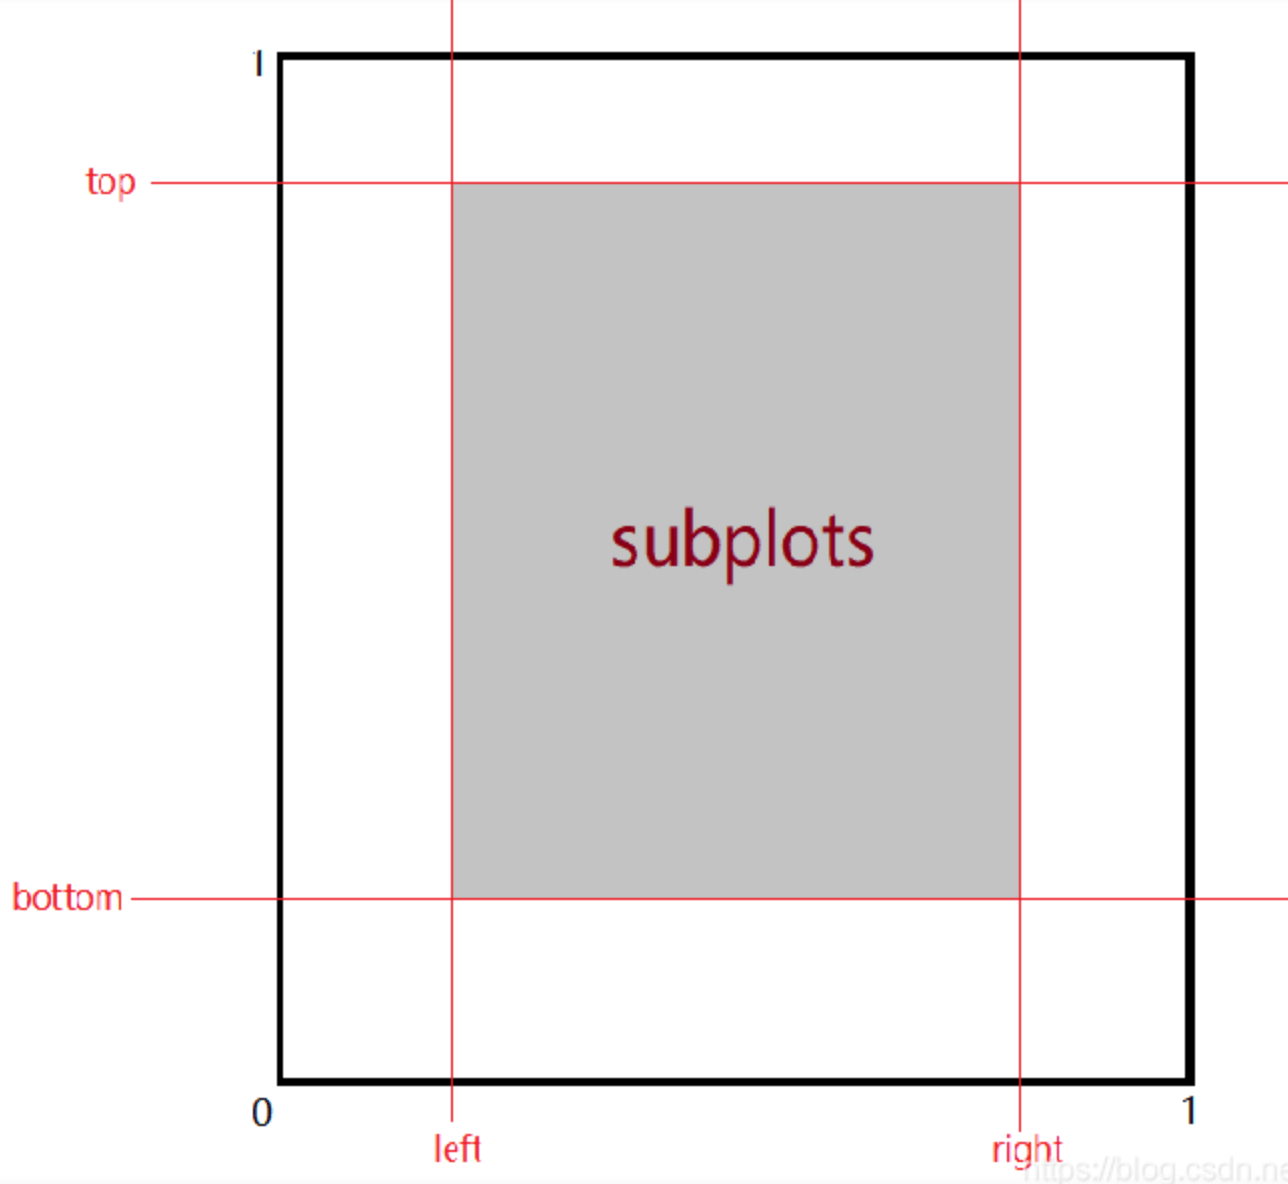
left,bottom,right,top用于设置子图所在区域相对于figsize的大小,当值大于1.0的时候子图区域会超出figure的边界从而显示不全。要保证left<right,bottom<top,否则会报错。
wspace和hspace用于控制子图之间的横向间距和纵向间距:
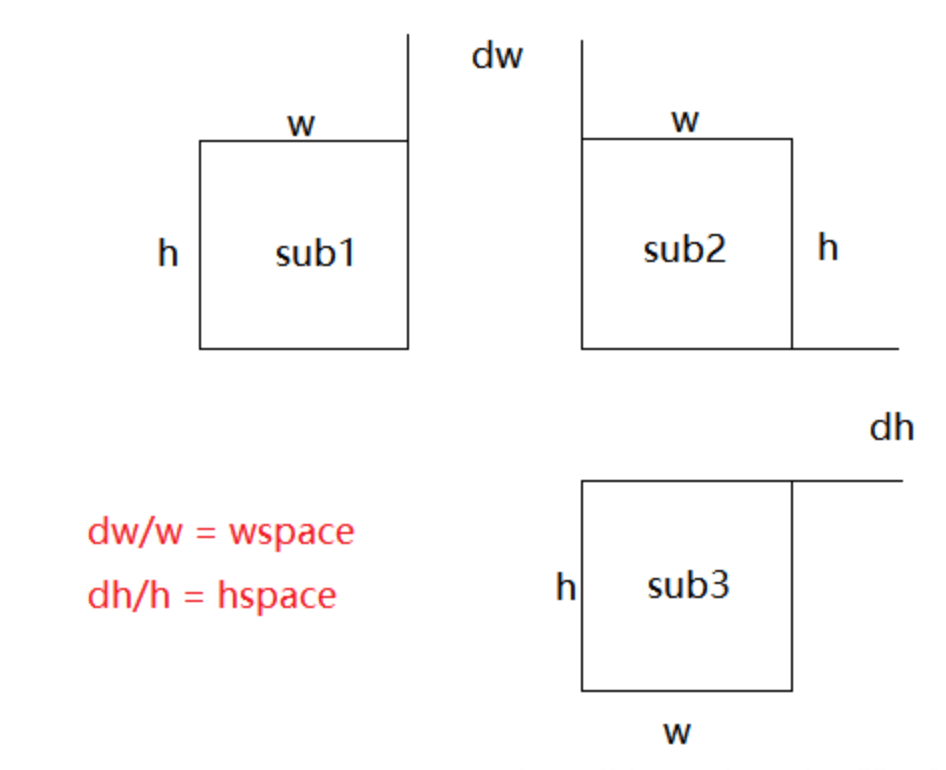
在所有子图不超出left,right,top,bottom所围区域的条件下,子图的长宽比不变,而是按比例缩小,所以调整横向间距也可能影响纵向间距,反之亦然。
3.3.add_subplot
1
ax = fig.add_subplot(6, 6, i + 1, xticks=[], yticks=[])
$6\times 6$为子图的数量,i+1表示目前正在添加的子图的序号。
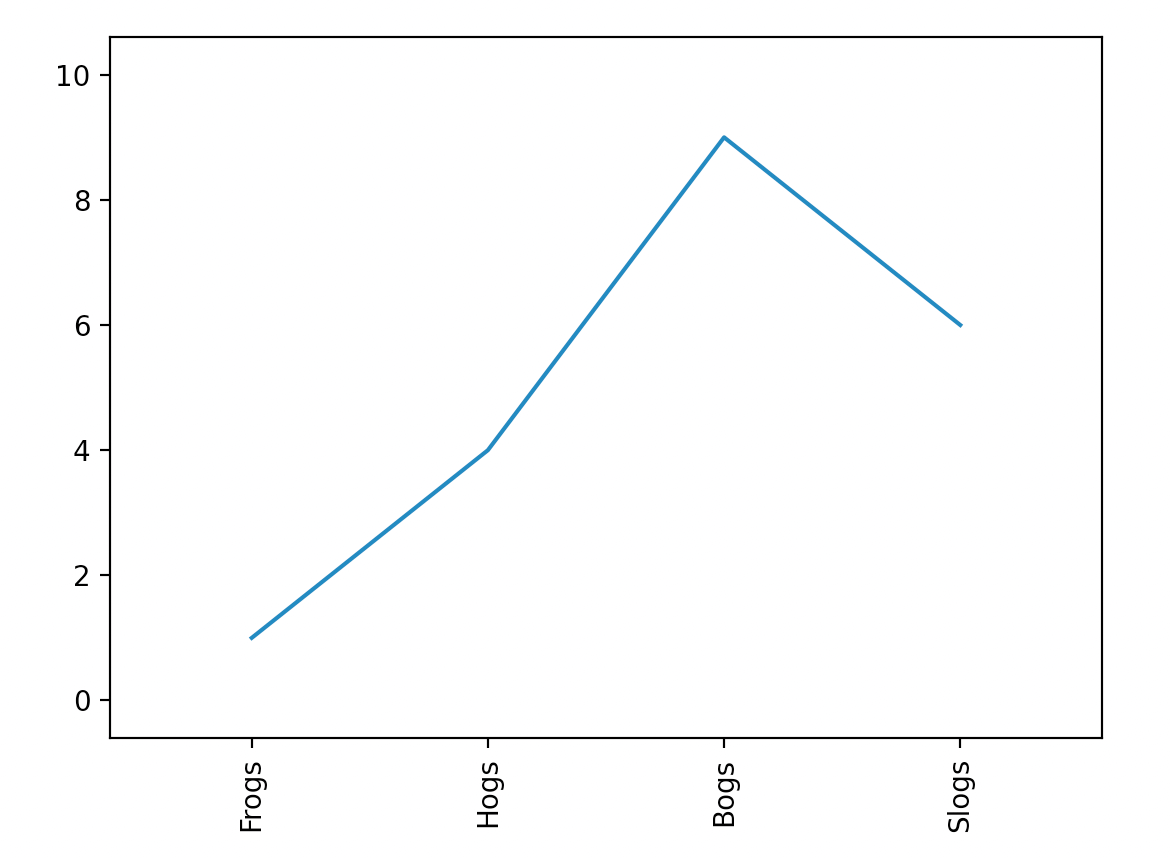
xticks和yticks用于自定义横纵坐标,举个例子:
1
2
3
4
5
6
7
8
9
10
11
12
13
14
15
import matplotlib.pyplot as plt


x = [1, 2, 3, 4]
y = [1, 4, 9, 6]
labels = ['Frogs', 'Hogs', 'Bogs', 'Slogs']

plt.plot(x, y)
# You can specify a rotation for the tick labels in degrees or with keywords.
plt.xticks(x, labels, rotation='vertical')
# Pad margins so that markers don't get clipped by the axes
plt.margins(0.2)
# Tweak spacing to prevent clipping of tick-labels
plt.subplots_adjust(bottom=0.15)
plt.show()
3.4.plt.text
1
ax.text(0, 7, str(digits.target[i]), color="red", fontsize=20)
plt.text用于向图像添加文字。(0,7)为文本框的x,y坐标,str(digits.target[i])为要添加的文字,color和fontsize为文字的颜色和大小。