本文为原创文章,未经本人允许,禁止转载。转载请注明出处。
1.读取数据
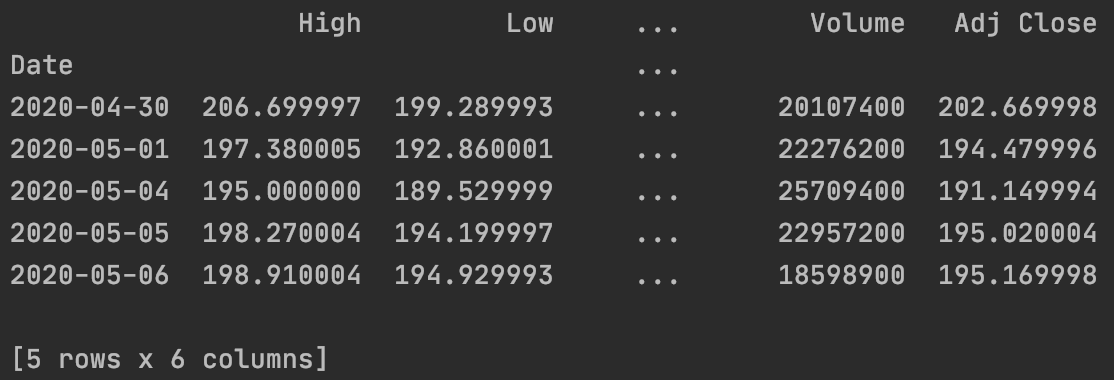
我们以爬取的股价信息为例:
1
2
3
import pandas_datareader
df = pandas_datareader.DataReader('BABA', data_source='yahoo', start='2020-05-01')
print(df.head())
2.pandas.DataFrame.plot()
pandas画图函数的API为:
1
2
3
4
5
6
7
8
DataFrame.plot(x=None, y=None, kind='line', ax=None, subplots=False,
                sharex=None, sharey=False, layout=None, figsize=None,
                use_index=True, title=None, grid=None, legend=True,
                style=None, logx=False, logy=False, loglog=False,
                xticks=None, yticks=None, xlim=None, ylim=None, rot=None,
                fontsize=None, colormap=None, position=0.5, table=False, yerr=None,
                xerr=None, stacked=True/False, sort_columns=False,
                secondary_y=False, mark_right=True, **kwds)
部分参数解释:
x:x轴label。y:y轴label。kind:图类型:figsize:图的大小,用一个tuple表示:(width,height)(单位为英寸)。title:图的名字或标题。grid:背景是否添加网格线。legend:是否显示图例。rot:x轴label旋转角度。
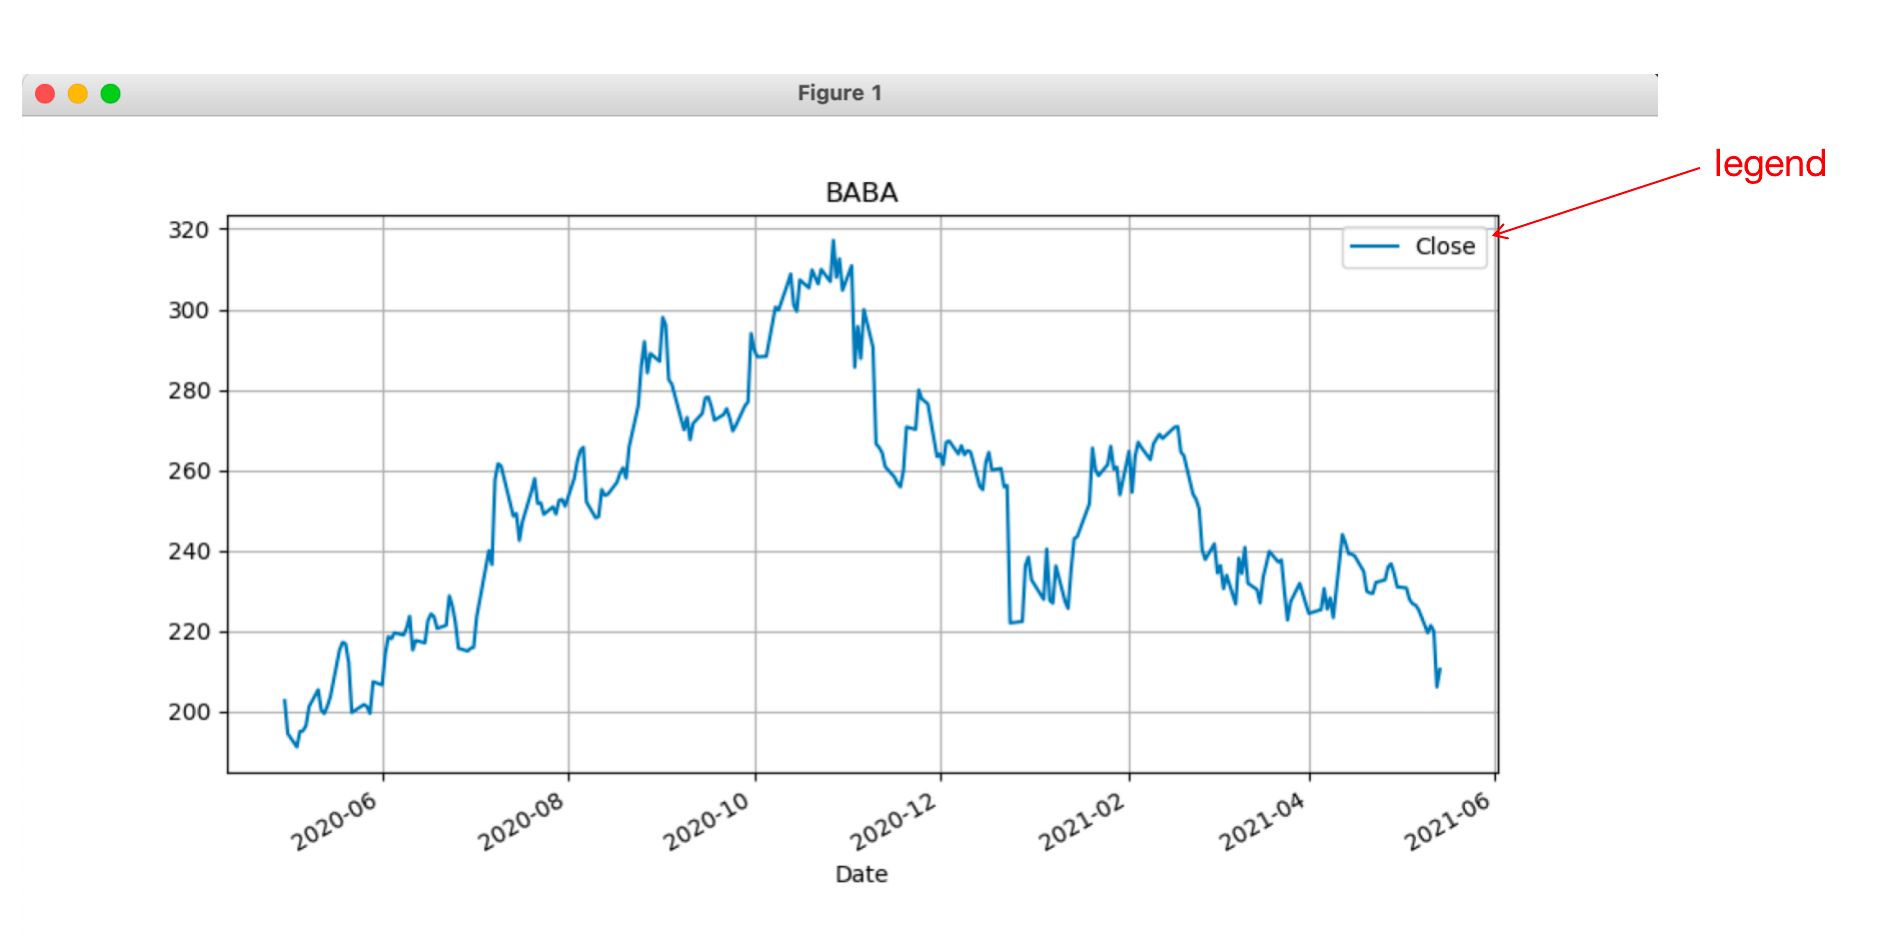
2.1.绘制折线图
1
df['Close'].plot(kind='line', figsize=[10, 5], title='BABA', legend=True, grid=True)
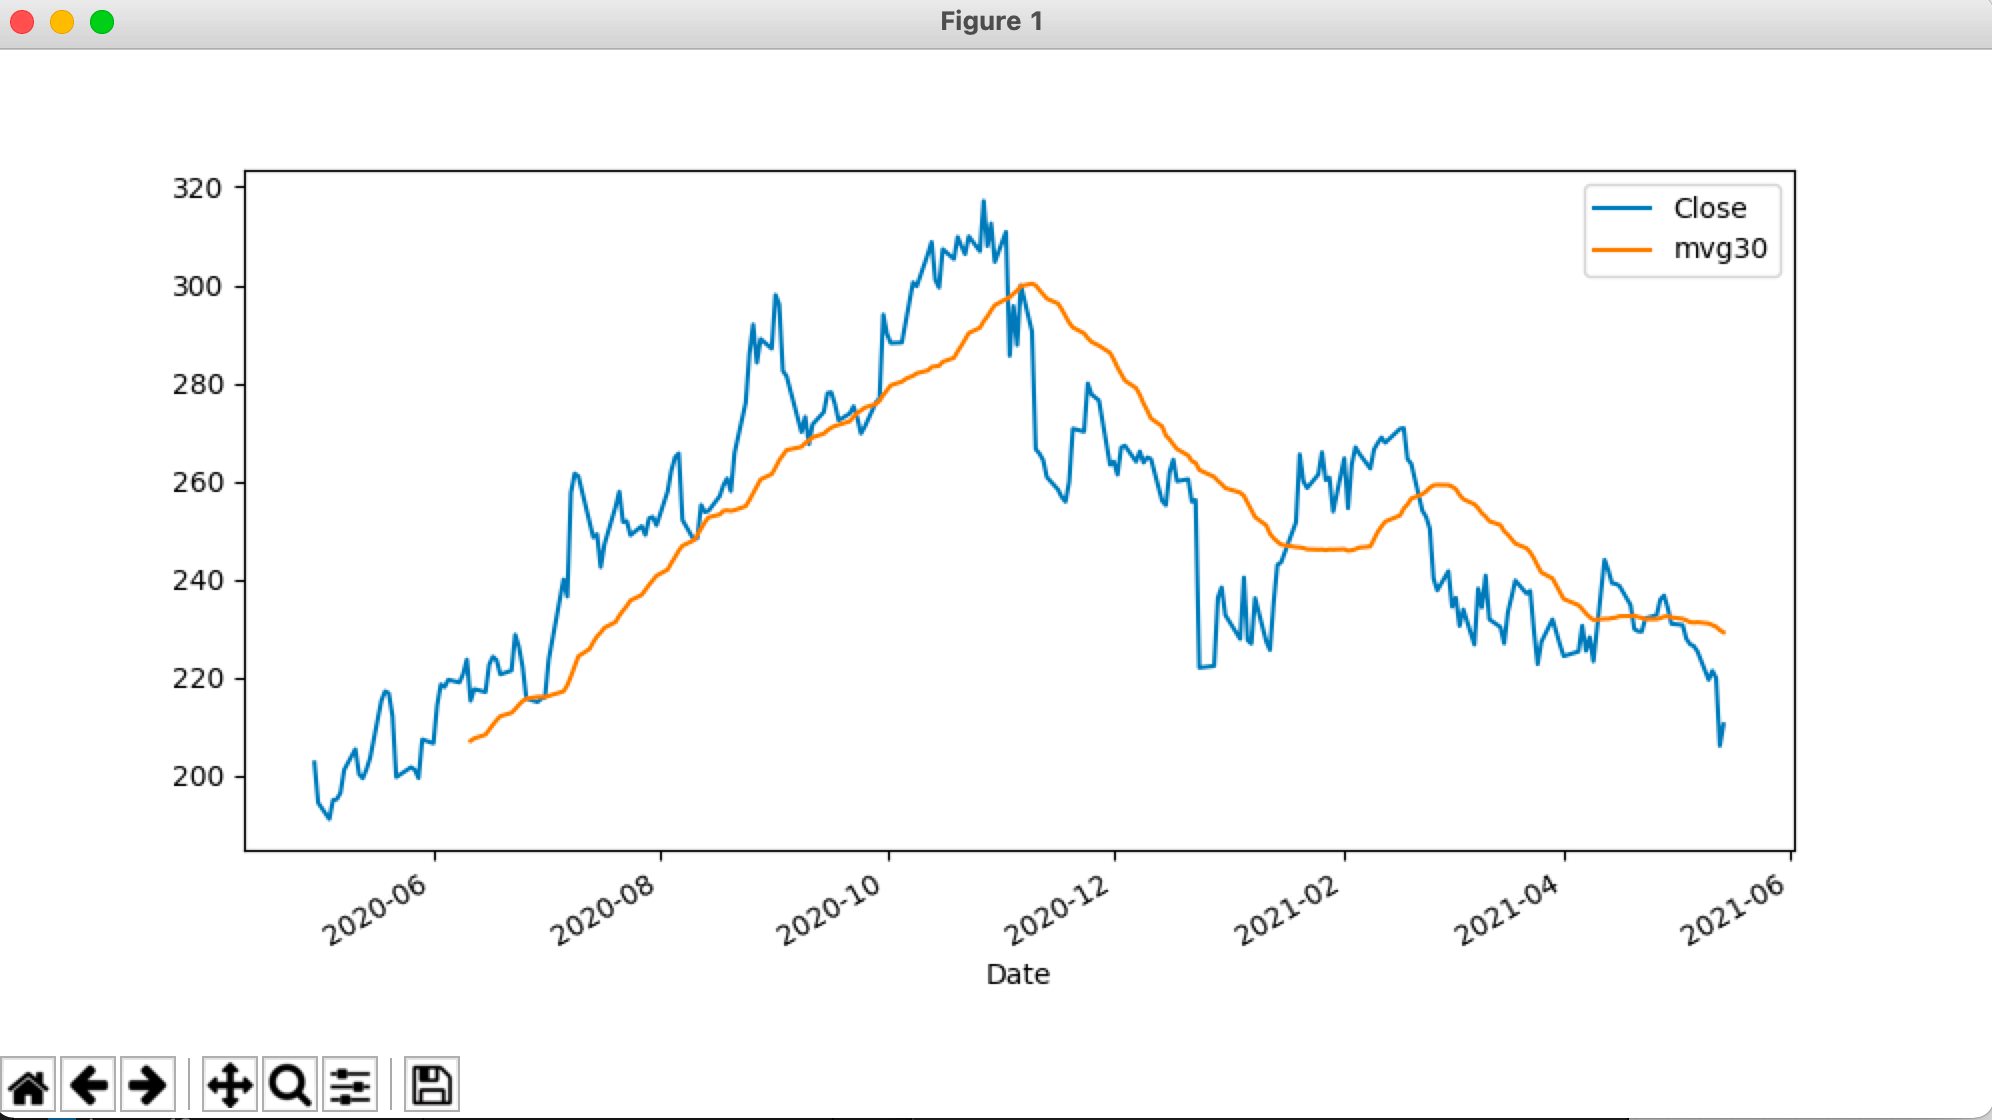
2.2.绘制移动平均线
1
2
df['mvg30'] = df['Close'].rolling(window=30).mean()
df[['Close', 'mvg30']].plot(kind='line', legend=True, figsize=[10, 5])
2.2.1.pandas.DataFrame.rolling()
在建模过程中,我们常常需要对有时间关系的数据进行整理。比如我们想要得到某一时刻过去30分钟的销量(产量,速度,消耗量等),传统方法复杂消耗资源较多,pandas提供的rolling使用简单,速度较快。
1
DataFrame.rolling(window, min_periods=None, center=False, win_type=None, on=None, axis=0, closed=None)
参数解释:
window:表示时间窗的大小,注意有两种形式(int or offset)。如果使用int,则数值表示计算统计量的观测值的数量,即向前几个数据。如果是offset类型,则表示时间窗的大小。min_periods:最少需要有值的观测点的数量,对于int类型,默认与window相等。对于offset类型,默认为1。center:是否使用window的中间值作为label,默认为false。只能在window是int时使用。win_type:窗口类型。默认为None,一般不特殊指定。on:对于DataFrame如果不使用index(索引)作为rolling的列,那么用on来指定使用哪列。axis:方向(轴),一般都是0。closed:定义区间的开闭,曾经支持int类型的window,新版本已经不支持了。对于offset类型默认是左开右闭的,即默认为right。可以根据情况指定为left,both等。
2.3.绘制直方图
1
df.loc[df.index >= '2021-05-01', 'Volume'].plot(x='datetime', kind='bar', figsize=[10, 5], title='BABA', legend=True)

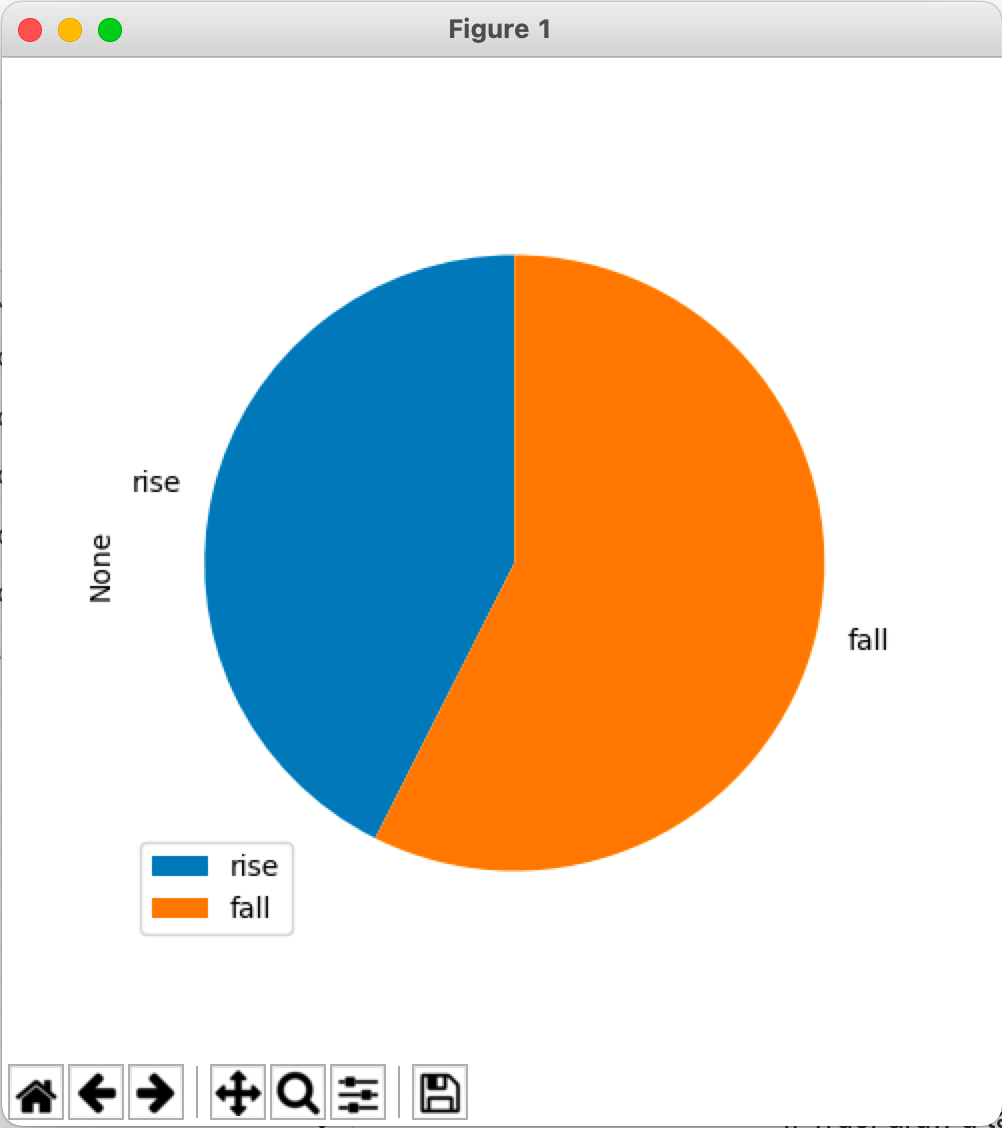
2.4.饼图
1
2
3
4
df['diff'] = df['Close'] - df['Open']
df['rise'] = df['diff'] > 0
df['fall'] = df['diff'] < 0
df[['rise', 'fall']].sum().plot(kind='pie', figsize=[5, 5], counterclock=True, startangle=90, legend=True)