本文为原创文章,未经本人允许,禁止转载。转载请注明出处。
1.读取客户流失数据
1
2
3
4
5
# 读取客户流失数据
import pandas

df = pandas.read_csv("customer_churn.csv", index_col=0, header=0)
print(df.head())
1
2
3
4
5
6
7
8
  state  account_length  ... number_customer_service_calls churn
1    KS             128  ...                             1    no
2    OH             107  ...                             1    no
3    NJ             137  ...                             0    no
4    OH              84  ...                             2    no
5    OK              75  ...                             3    no

[5 rows x 20 columns]
2.数据前处理
1
2
3
4
5
6
7
8
# 数据前处理
df = df.iloc[:, 3:]
cat_var = ['international_plan', 'voice_mail_plan', 'churn']

for var in cat_var:
    df[var] = df[var].map(lambda e: 1 if e == "yes" else 0)
y = df.iloc[:, -1]
X = df.iloc[:, :-1]
3.区分训练与测试数据集
1
2
3
4
# 区分训练与测试数据集
from sklearn.model_selection import train_test_split

train_X, test_X, train_y, test_y = train_test_split(X, y, test_size=0.33, random_state=123)
4.使用决策树建立分类模型
1
2
3
4
5
from sklearn import tree

clf = tree.DecisionTreeClassifier(max_depth=3)
clf.fit(train_X, train_y)
predicted = clf.predict(test_X)
5.产生混淆矩阵以及其他评估指标
1
2
3
from sklearn.metrics import accuracy_score

print(accuracy_score(test_y, predicted))
1
0.8936363636363637
1
2
3
4
from sklearn.metrics import confusion_matrix

m = confusion_matrix(test_y, predicted)
print(m)
1
2
[[924  26]
 [ 91  59]]
1
2
3
from sklearn.metrics import classification_report

print(classification_report(test_y, predicted))
1
2
3
4
5
6
             precision    recall  f1-score   support

          0       0.91      0.97      0.94       950
          1       0.69      0.39      0.50       150

avg / total       0.88      0.89      0.88      1100
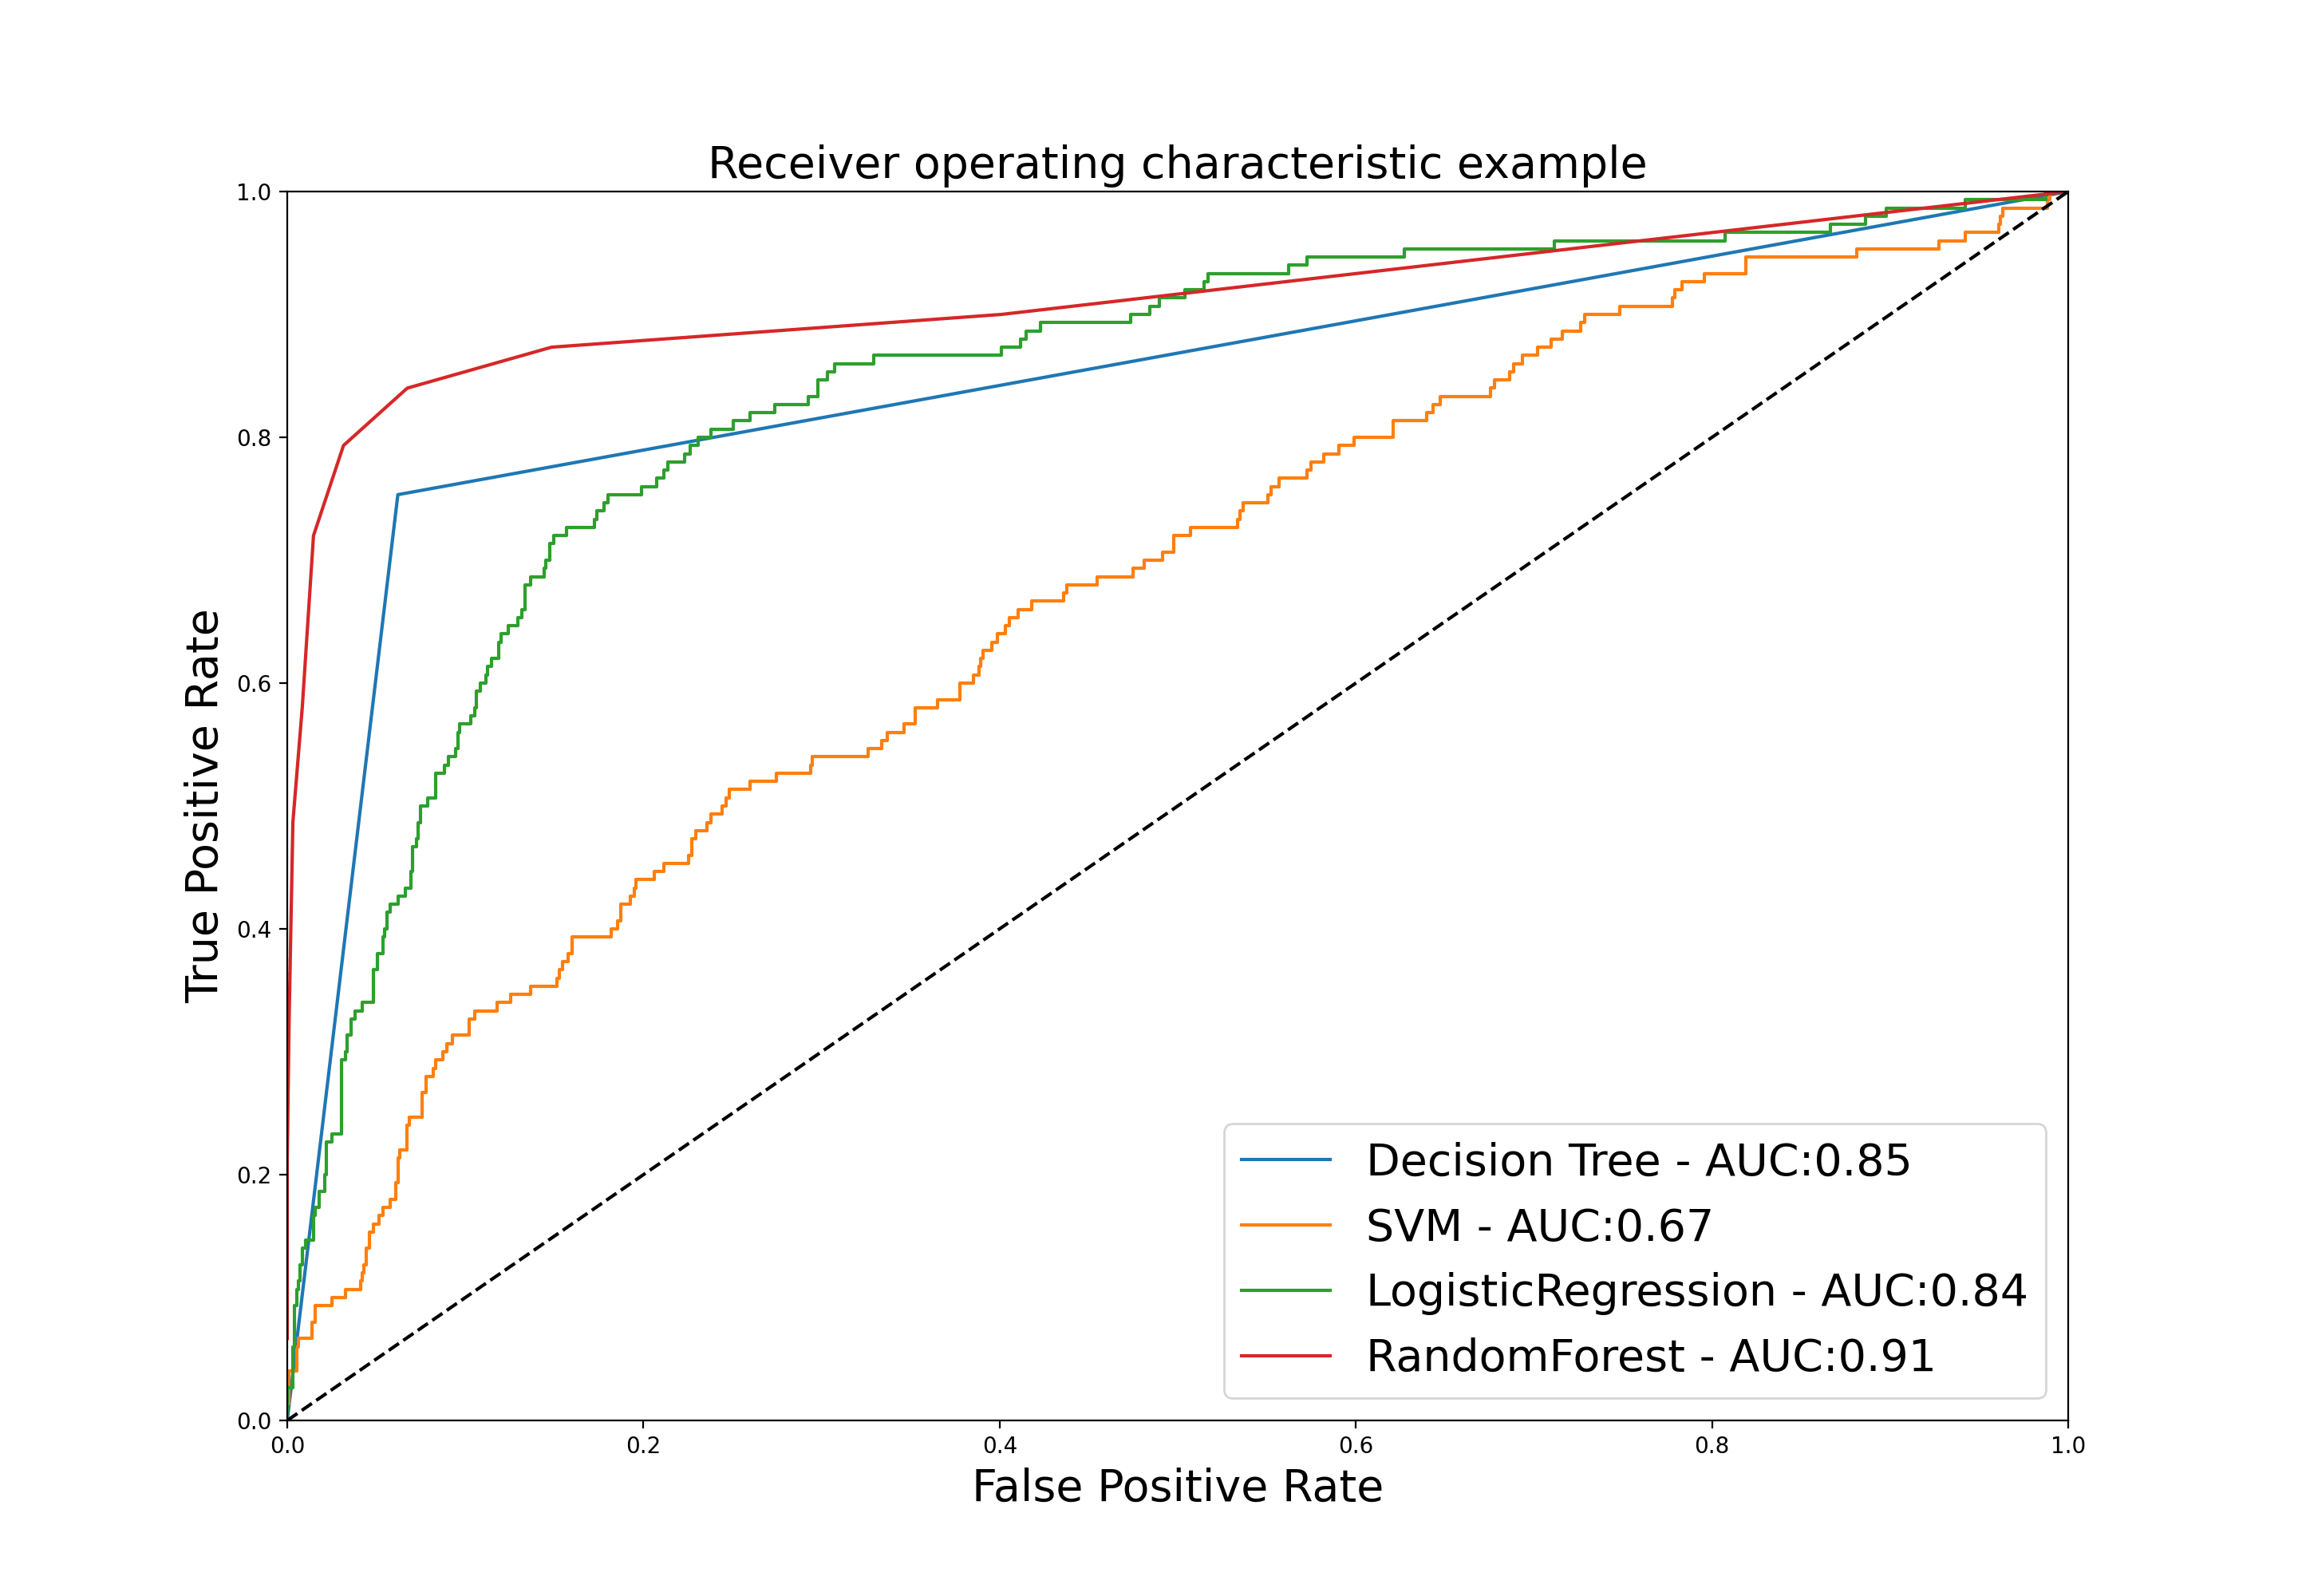
6.使用ROC曲线比较模型
参照:
【Python基础】第二十九课:分类模型之SVM。
【Python基础】第二十八课:分类模型之Logistic Regression。
【Python基础】第三十一课:分类模型之随机森林。
【Python基础】第三十五课:ROC曲线。
1
2
3
4
5
6
7
8
9
10
11
12
13
14
15
16
17
18
19
20
21
22
23
24
25
26
27
28
29
30
31
32
33
34
35
36
37
38
# 使用ROC曲线比较模型
from sklearn.tree import DecisionTreeClassifier

clf1 = DecisionTreeClassifier()
clf1.fit(train_X, train_y)

from sklearn.svm import SVC

clf2 = SVC(probability=True, kernel='linear', cache_size=7000, max_iter=10000)
clf2.fit(train_X, train_y)

from sklearn.linear_model import LogisticRegression

clf3 = LogisticRegression()
clf3.fit(train_X, train_y)

from sklearn.ensemble import RandomForestClassifier

clf4 = RandomForestClassifier()
clf4.fit(train_X, train_y)

import matplotlib.pyplot as plt
from sklearn.metrics import roc_curve, auc

plt.figure(figsize=[20, 10])
for clf, title in zip([clf1, clf2, clf3, clf4], ['Decision Tree', 'SVM', 'LogisticRegression', 'RandomForest']):
    probas_ = clf.fit(train_X, train_y).predict_proba(test_X)
    fpr, tpr, thresholds = roc_curve(test_y, probas_[:, 1])
    plt.plot(fpr, tpr, label='%s - AUC:%.2f' % (title, auc(fpr, tpr)))

plt.plot([0, 1], [0, 1], 'k--')
plt.xlim([0.0, 1.0])
plt.ylim([0.0, 1.0])
plt.xlabel('False Positive Rate', fontsize=20)
plt.ylabel('True Positive Rate', fontsize=20)
plt.title('Receiver operating characteristic example', fontsize=20)
plt.legend(loc="lower right", fontsize=20)
plt.show()
SVC()中的参数cache_size用于指定训练所需要的内存,以MB为单位,默认为200MB;参数max_iter为最大迭代次数。
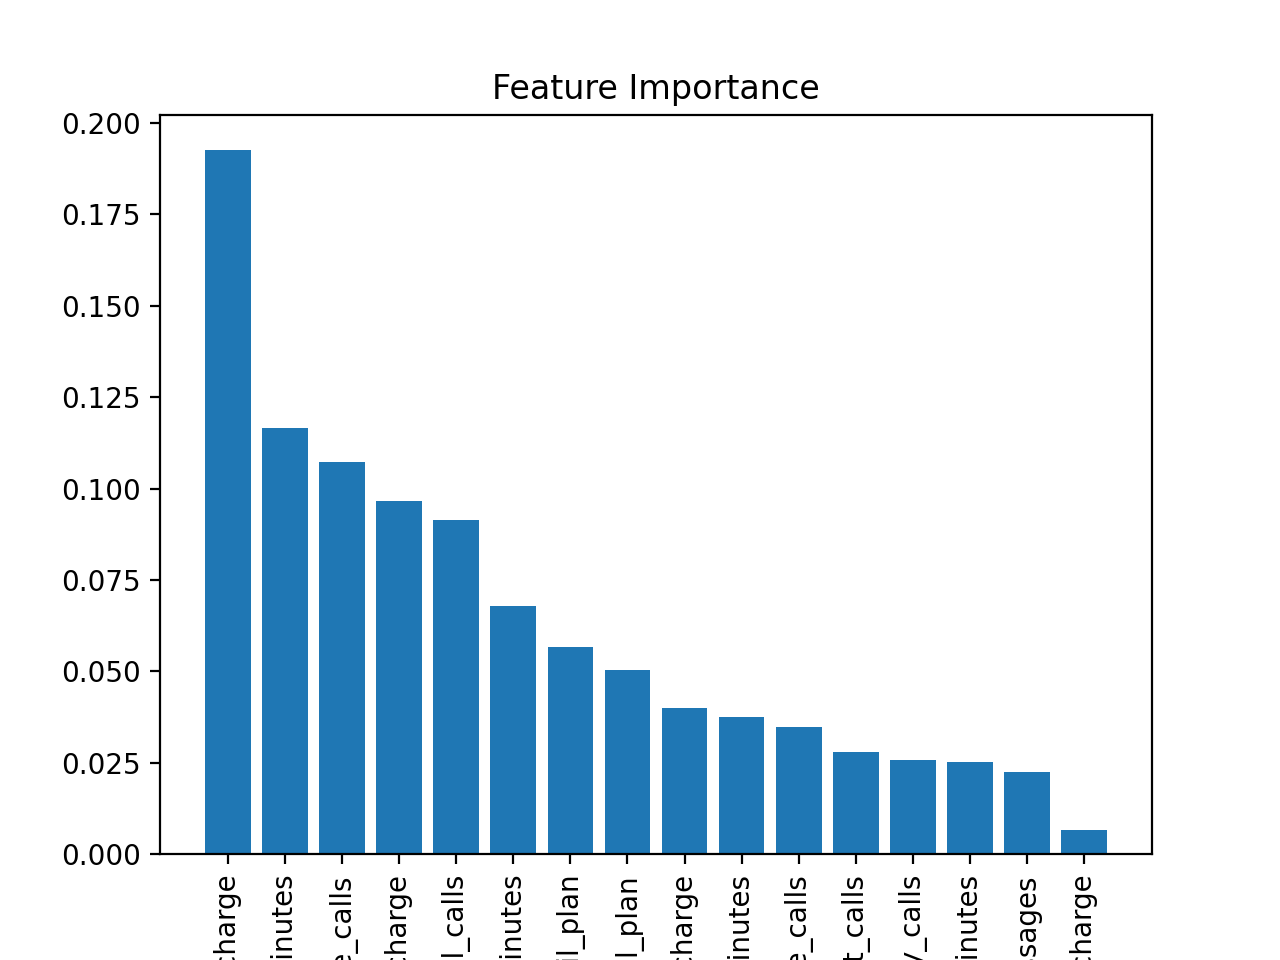
7.评估特征重要性
针对树形分类器(比如决策树、随机森林等),评估特征重要性:
1
2
print(clf1.feature_importances_)
print(train_X.columns[clf1.feature_importances_.argsort()[::-1]])
1
2
3
4
5
6
7
8
9
10
[0.05208444 0.06251173 0.01326524 0.17763805 0.02625589 0.11688188
 0.03232766 0.03985179 0.10419267 0.03593315 0.02579825 0.02866328
 0.0680222  0.08481536 0.01926201 0.11249638]
Index(['total_day_charge', 'total_day_minutes',
       'number_customer_service_calls', 'total_intl_calls', 'total_eve_charge',
       'number_vmail_messages', 'total_intl_charge', 'total_eve_minutes',
       'international_plan', 'total_night_minutes', 'total_eve_calls',
       'total_night_calls', 'total_night_charge', 'total_day_calls',
       'total_intl_minutes', 'voice_mail_plan'],
      dtype='object')
个人理解:特征重要性的评估应该是依据决策树的划分准则。比如使用最重要的特征进行划分带来的信息增益(当然也可以是其他划分准则,比如增益率、基尼指数等)最大。
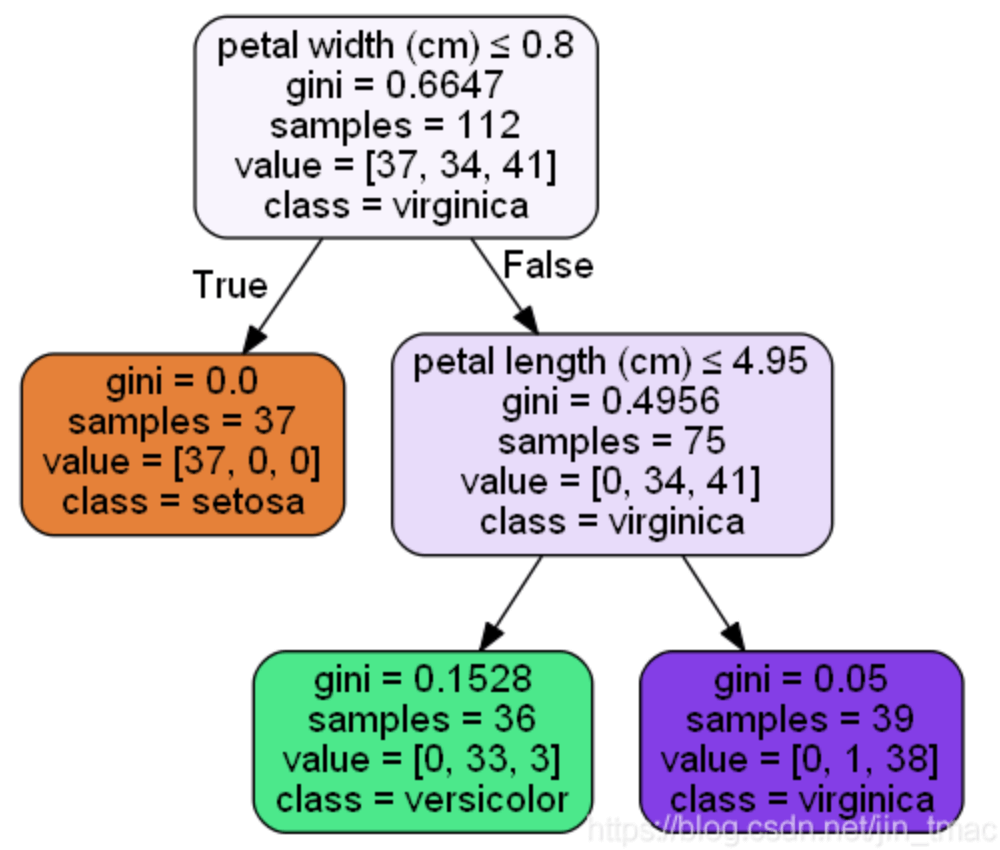
feature_importances_是以基尼指数为基础进行计算的。以iris数据集为例,数据有四个属性:sepal length、sepal width、petal length、petal width。按基尼指数划分原则得到以下决策树:
使用feature_importances_得到的四个属性的重要性指标:
- sepal length:0
- sepal width:0
- petal length:0.44366614
- petal width:0.55633386
下面说一下是怎么算的。首先,根结点petal width:
\[\frac{112 \times 0.6647 - 75\times 0.4956 - 37 \times 0}{112}=0.332825\]另一个结点petal length:
\[\frac{75 \times 0.4956 - 39 \times 0.05 - 36 \times 0.1528}{112}=0.26535\]进行归一化:
\[\frac{0.332825}{0.332825+0.26535}=0.5564007189\] \[\frac{0.26535}{0.332825+0.26535}=0.4435992811\]忽略上图中gini计算的小数位数,计算结果相同。可视化:
1
2
3
4
5
6
7
8
import matplotlib.pyplot as plt

importance = clf1.feature_importances_
names = train_X.columns
plt.title("Feature Importance")
plt.bar(range(0, len(names)), importance[importance.argsort()[::-1]])
plt.xticks(range(0, len(names)), names[importance.argsort()[::-1]], rotation=90)
plt.show()